Will Crypto Recover? What the Data Says in 2026

The question is on every investor's mind right now: will crypto recover? After a period of significant market volatility, Bitcoin sitting at $63,000, Ethereum holding around $1,663, and total market capitalization at $2.17 trillion, many investors are trying to figure out whether the worst is over — or if more turbulence lies ahead.
The short answer is that crypto has recovered from every major downturn in its history. The more useful question is when, by how much, and which signals to watch. This article breaks down the historical recovery patterns, the on-chain and macro indicators that matter most, and what the current data on Coinlib suggests about where the market is heading.
How Crypto Has Recovered Before
Crypto markets are cyclical by nature. Understanding past recoveries is the most reliable framework for evaluating the current environment.
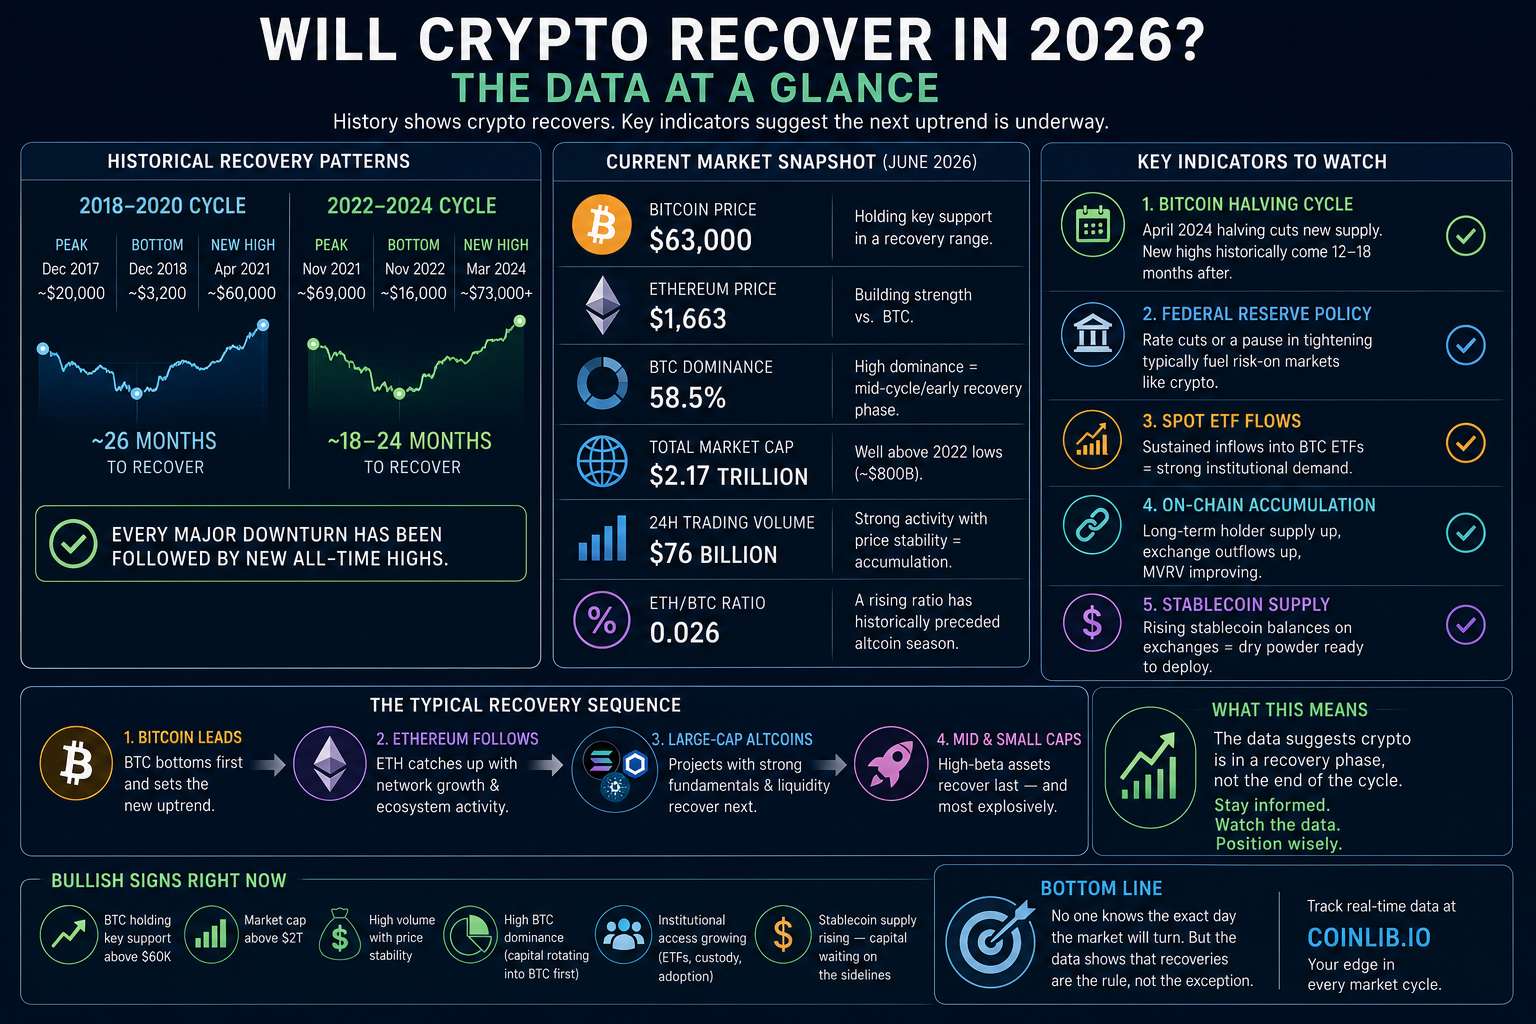
2018–2020 Bear Market. After Bitcoin peaked near $20,000 in December 2017, it fell over 84% to roughly $3,200 by December 2018. Recovery was slow and uneven, but by late 2020, Bitcoin had not only reclaimed its 2017 high — it had shattered it, reaching $60,000 in April 2021. The full recovery took approximately 26 months from the bottom.
2022 Bear Market. The 2022 cycle saw Bitcoin drop from ~$69,000 to under $16,000 — a 77% drawdown — as macroeconomic tightening, the Terra/LUNA collapse, and the FTX implosion compounded losses across the market. Ethereum fell similarly hard. By the end of 2023, both assets had begun recovering, with Bitcoin retesting its all-time high in early 2024 and subsequently surpassing it. Recovery from the cycle low took roughly 18–24 months.
The pattern is consistent: deep drawdowns are followed by new highs, with recovery timelines ranging from 18 to 36 months. No major cycle has ended without Bitcoin eventually reaching a new all-time high.
What the Current Market Data Shows
You can track all of the following metrics in real time on Coinlib's market dashboard.
Bitcoin Dominance: 58.5%. Bitcoin dominance above 55% historically signals a mid-cycle or early-recovery phase, where capital is consolidating in BTC before rotating into altcoins. A dominance peak and subsequent decline has typically preceded broader altcoin rallies in past cycles.
Total Market Cap: $2.17 trillion. This is a healthy reading relative to the 2022 lows (~$800 billion). A sustained hold above $2 trillion historically reflects institutional participation and a broadly constructive risk environment.
24-Hour Trading Volume: $76 billion. High volume with price stability suggests accumulation rather than panic selling — a positive sign for recovery momentum.
ETH/BTC price ratio. Ethereum at $1,663 versus Bitcoin at $63,194 gives a ratio of roughly 0.026. Historically, when Ethereum begins outperforming Bitcoin (ratio rises), it signals that the broader altcoin season has begun — a late-cycle recovery indicator.
Key Indicators to Watch
Crypto recovery is rarely a single event. It is a process tracked by layered signals. Here are the most reliable ones to monitor:
1. The Bitcoin Halving Cycle. Bitcoin's most recent halving occurred in April 2024, cutting the block reward from 6.25 BTC to 3.125 BTC. Historically, new all-time highs have arrived 12–18 months after halving events. The cycle clock is running — 2025–2026 sits squarely in the historical recovery window.
2. Federal Reserve Monetary Policy. Crypto has had a strong inverse correlation with interest rate cycles. Rate hikes (2022–2023) crushed risk assets including crypto. Rate cuts or a pause in tightening historically coincide with crypto rallies. Any shift toward looser monetary policy in 2026 would be a significant tailwind.
3. Spot ETF Flows. The approval of Bitcoin spot ETFs in the United States in January 2024 represented a structural shift in how institutional capital can access crypto. Sustained net inflows into Bitcoin ETFs are one of the most reliable leading indicators for price recovery — and these can be tracked weekly via public filings.
4. On-Chain Accumulation. Metrics such as long-term holder supply (wallets holding BTC for more than 155 days), exchange outflows (BTC leaving exchanges signals holders moving to cold storage rather than selling), and the MVRV ratio (market value vs. realized value) all provide insight into whether smart money is accumulating or distributing.
5. Stablecoin Supply on Exchanges. Rising stablecoin balances on exchanges indicate dry powder waiting to be deployed into crypto assets. This is a bullish leading indicator — capital is positioned to buy, not to exit.
Is the Crypto Bull Run Over?
Based on current data, the evidence does not support the bear case that the bull run is over. Several factors point to continued recovery potential:
The Bitcoin halving cycle is on schedule. Post-halving bull runs have occurred in 2013, 2017, and 2021 — and while past performance does not guarantee future results, the macro supply shock created by halvings is a real and recurring phenomenon.
Bitcoin dominance remains elevated, suggesting the altcoin phase of the cycle has not yet fully played out. The top-gaining coins on Coinlib today — including assets showing gains of 277%–38,000% — represent the kind of speculative rotation that tends to occur in mid-to-late bull cycles.
The total crypto market cap at $2.17 trillion still sits well below the theoretical cycle peak range many analysts model based on previous cycles' percentage expansions from their halving-era bottoms.
That said, volatility is endemic to crypto markets. "Crypto crashing" remains a real risk, driven by regulatory news, macro shocks, or sudden liquidity events. Maintaining position sizing appropriate to personal risk tolerance is essential, regardless of the macro outlook.
Which Cryptocurrencies Tend to Recover First?
Not all assets recover at the same pace. Historical cycles suggest the following general sequence:
Bitcoin leads. As the highest-liquidity, most-recognized asset, BTC is typically the first to bottom and the first to establish a new uptrend. It acts as the risk-on barometer for the entire market.
Ethereum follows. ETH's recovery tends to lag Bitcoin by weeks to months but often catches up significantly, particularly driven by DeFi activity, network upgrades, and developer adoption metrics.
Large-cap altcoins (Solana, Chainlink, Cardano, etc.) recover next. These assets have established ecosystems and liquidity, making them the next layer of rotation after BTC and ETH stabilize.
Mid and small caps recover last — and most violently. Assets in the $100M–$1B market cap range can deliver outsized gains in the final phase of a bull run, but they also carry the highest risk of not recovering at all if their fundamentals have deteriorated.
You can track the full market cap rankings, 7-day and 24-hour price changes, and trading volume for all of these assets across the Coinlib coin listings.
How to Track Crypto Recovery in Real Time
The most practical way to monitor whether crypto is recovering is to track a handful of key metrics consistently, rather than relying on headlines. Coinlib provides all of the following in one place:
Live price charts and market cap rankings for over 1,000 coins, filterable by network (Ethereum, BNB Chain, Solana, Base, and more), giving a real-time picture of where capital is flowing.
The Compare tool at coinlib.io/compare lets you place any two coins side-by-side — price performance, market cap, volume, and supply — so you can evaluate relative strength during a recovery and identify which assets are leading.
Trending and Top Gainers panels on the homepage surface early momentum signals — assets beginning to attract volume before mainstream attention catches up.
Portfolio tracking lets you log your holdings and see your real-time exposure, which is invaluable for managing risk during a volatile recovery phase.
The Bottom Line
Will crypto recover? The historical record, current on-chain data, and macro cycle positioning all suggest the answer is yes — but recovery is a process, not a single date. Bitcoin dominance, halving cycle timing, institutional ETF flows, and total market cap are the metrics worth watching closely.
The most important thing any investor can do is stay informed with accurate, real-time data rather than reacting to noise. Bookmark Coinlib's market dashboard to track price movements, compare assets, and monitor the market cap trends that will signal when the next leg of the recovery is underway.
Frequently Asked Questions About Crypto Recovery
Will crypto recover in 2026? Based on historical cycle data and current market indicators, crypto is well-positioned to continue recovering in 2026. Bitcoin's halving in April 2024 historically triggers a bull cycle 12–18 months later, placing 2025–2026 squarely in the recovery window. The total market cap at $2.17 trillion and Bitcoin dominance at 58.5% further support a constructive outlook, though no outcome is guaranteed.
When will crypto go back up? There is no fixed date, but several indicators suggest the recovery is already underway. Bitcoin has held above $60,000, total market cap is above $2 trillion, and institutional ETF inflows have remained positive. Historically, post-halving price expansions play out over 12–24 months — meaning the current period aligns closely with previous recovery timelines.
Is crypto dead? No. Crypto has been declared "dead" hundreds of times since Bitcoin launched in 2009, yet the market has reached new all-time highs after every major crash. With a total market cap of $2.17 trillion, over 1,000 actively traded assets, and growing institutional and regulatory recognition globally, the crypto market is structurally more resilient today than in any previous cycle.
Is the crypto bull run over? Current data does not support the conclusion that the bull run is over. Bitcoin dominance remains elevated above 58%, which historically precedes an altcoin rotation phase — typically a mid-to-late bull cycle signal rather than a cycle top. That said, short-term corrections of 20–40% are normal even within bull markets and should be expected.
Which crypto will recover the fastest? Bitcoin and Ethereum have historically been the first large-cap assets to recover, followed by large-cap altcoins like Solana, Chainlink, and Cardano. Smaller-cap assets tend to surge last but also carry the most risk. Tracking real-time price performance and volume on Coinlib can help identify which assets are showing early recovery momentum.
How long does a crypto recovery typically take? Based on the 2018 and 2022 bear markets, full recoveries — meaning a return to and surpassing of previous all-time highs — have taken between 18 and 36 months from the cycle low. The 2022 cycle low was in November 2022, which puts the current period well within the historical recovery window.
What causes crypto to recover? Crypto recoveries are typically driven by a combination of factors: Bitcoin halving supply shocks, macroeconomic tailwinds (such as interest rate cuts), growing institutional adoption, positive regulatory developments, and renewed retail interest. Monitoring metrics like market cap, BTC dominance, stablecoin exchange balances, and ETF inflows on platforms like Coinlib gives the clearest picture of recovery momentum.
Should I buy crypto now or wait for recovery? This depends entirely on your personal risk tolerance, investment horizon, and financial situation. Historically, accumulating during periods of fear and low prices has rewarded long-term holders, but short-term volatility can be extreme. This article is for informational purposes only and does not constitute financial advice.